

In the context of public health, Geographic Information System (GIS) provides a framework to gather, map, and analyze data that helps to identify, educate, and inform the community on health-related issues, such as patterns of disease distribution and associated social and environmental factors (e.g., infant mortality and socioeconomic need). GIS mapping assists health professionals to set priorities that would subsequently inform decision-makers to enact polices that would improve the well-being of the community.
The following GIS mapping services are provided by the Health Council of Southeast Florida:
Heat map analysis: Helps to understand patterns of disease distribution according to geography (zip code, census tract, block group)
Geocode analysis: Illustrates assets in the community to allocate resources appropriately
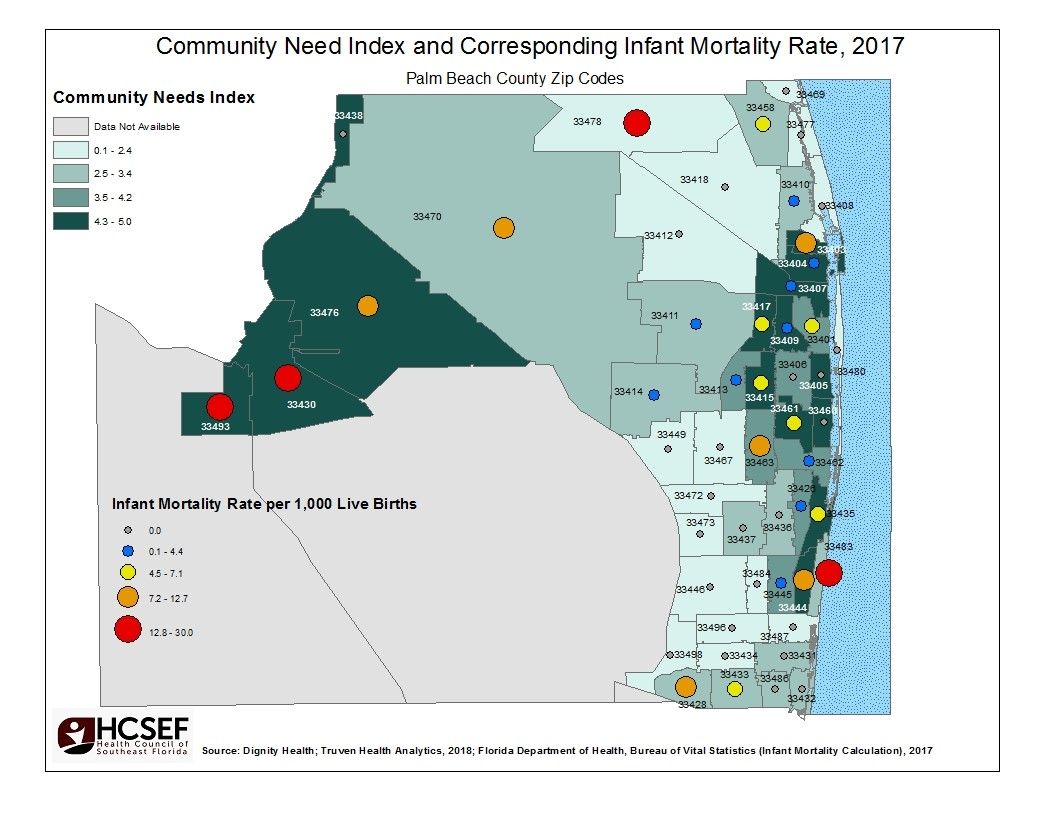
Dual indicator analysis*: Helps to understand the association between two indicators (e.g., preventable hospitalizations and education level)
Granular-level analysis: This level of analysis helps to bring to light disparities that may exist within subpopulations in a specific geographic area. An example of this type of analysis would involve comparing the percentage of population with health insurance in a specific zip code versus the percentage of population with health insurance by census tract in that zip code. It is important to highlight that in many instances, the availability of census tract or block group-level data is limited.
*An Example of Dual Indicator Analysis:
For more information, please contact Andrea Stephenson Royster at 561-844-4220 x2500 or astephenson@hcsef.org.